

Here’s a thing you already know about me: I love to read and I read a lot of books.
Here’s something you may not know about me: I’m a total statistics nerd. I love data analysis and graphs. I can get actual enjoyment out of running numbers and analyzing patterns.
So, even though it’s July, I decided to crunch some numbers and analyze the data regarding my reading habits for 2018. Fair warning, it’s a LOT of information. But if you like data as much as I do, you may enjoy the patterns here. I know I did!
In 2018 I read a total of 101 books.
All 101 of those were entered into Goodreads, which is how I did some of this analysis. However, Goodreads isn’t great for genre analysis. So for that, I relied on a little spreadsheet I created. The spreadsheet also allowed for graphs.
Here’s the breakdown of books read by month.
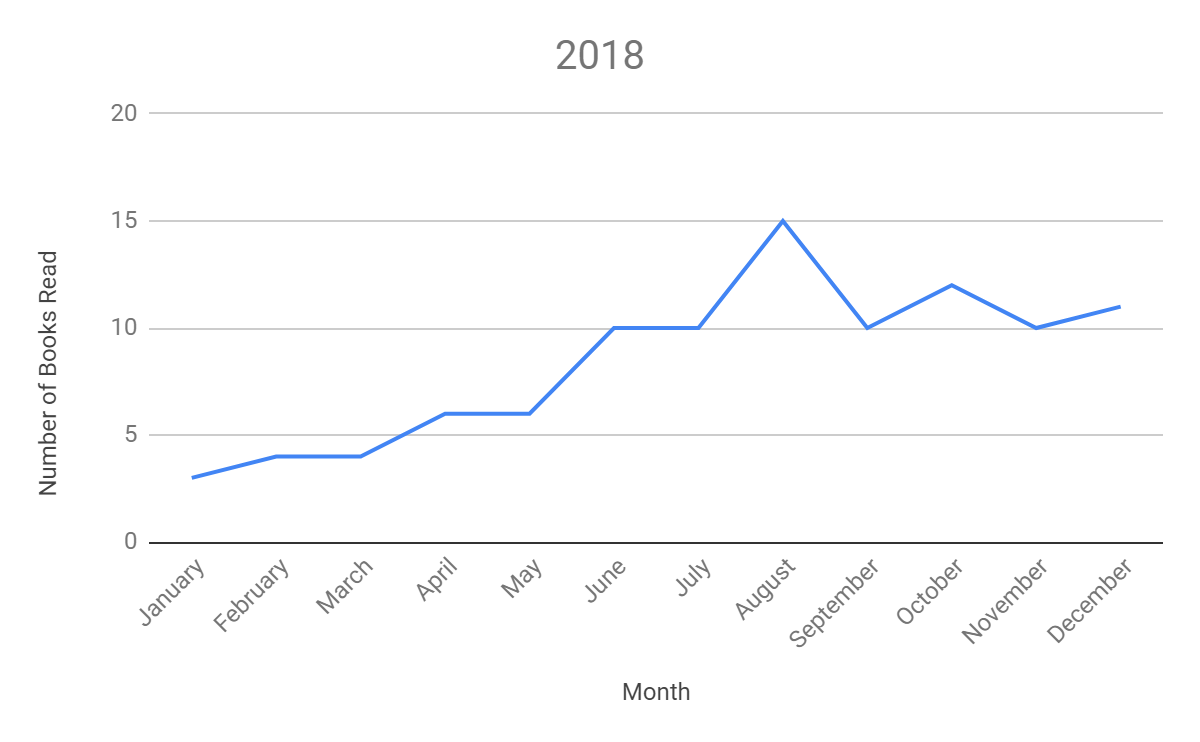
It makes sense that January-May is lower. During those months I was teaching full time. Then I switched to writing full time, which allowed me more time to read. I found the spike in August interesting. I can’t think of a single reason why my reading time would spike up in August. Sure, the kids are back in school, but shouldn’t it stay that high if that were the only reason? So I decided to analyze PAGES read. Maybe I was reading longer books later in the Fall.
Turns out I read a total of 35,779 pages last year.
Here’s the breakdown by month.
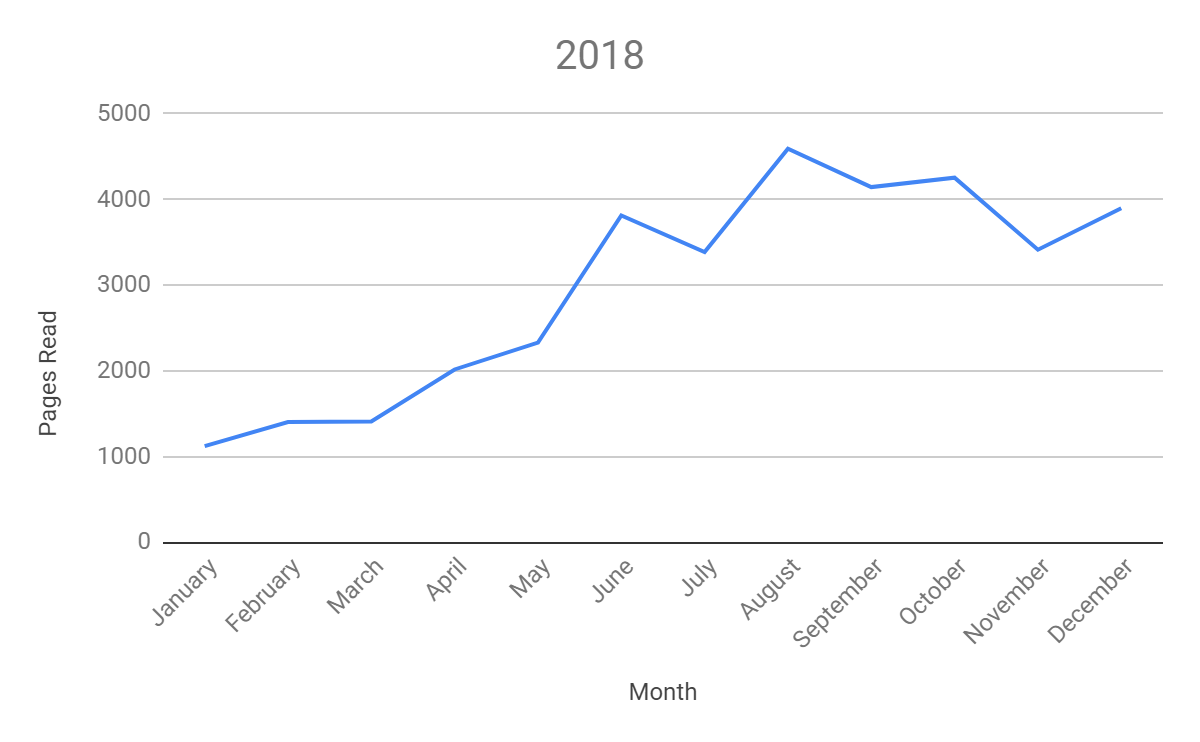
This graph does show a small spike in August, but this graph is more balanced than the books graph. That tells me I read longer books in October and maybe even December. I don’t really know what the November slump was so I’ll just blame it on Thanksgiving and my birthday.
But that’s not the crux of what I analyzed. Let’s dig into the crazy stuff, shall we?
I broke down what I read by gender of the author, just for the heck of it. Here’s a pie graph for you to enjoy.
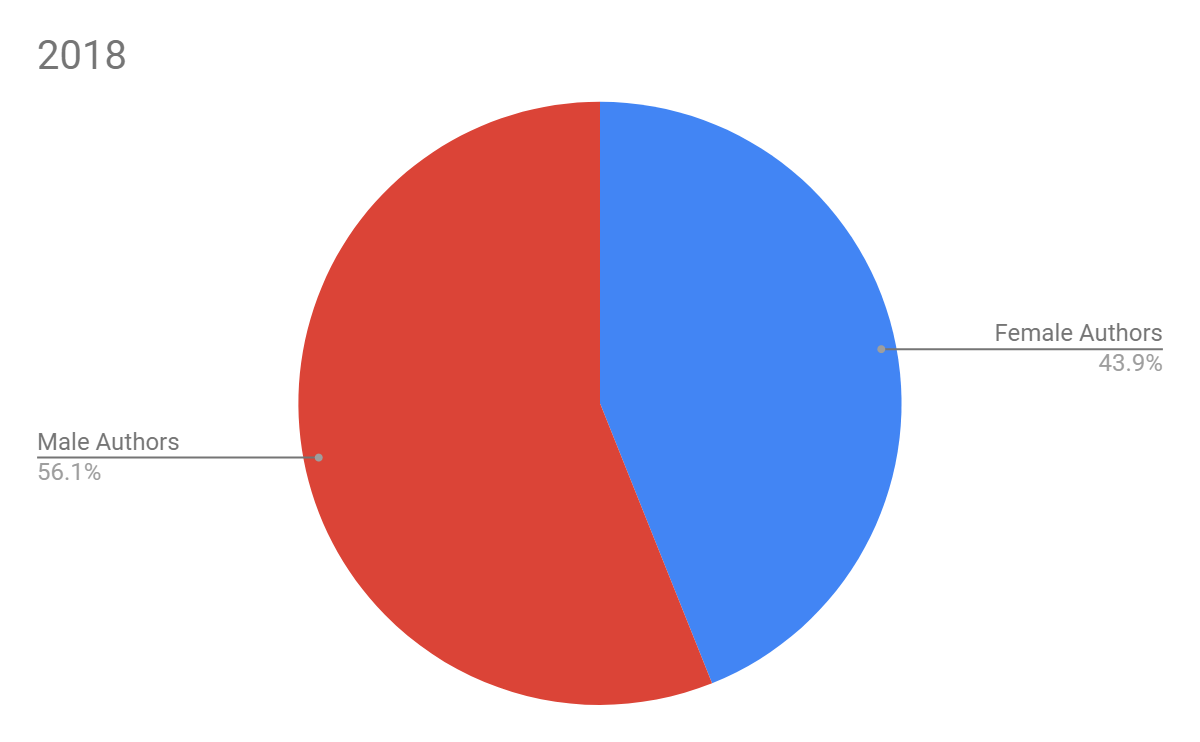
It turns out that I read primarily male authors in 2018. Now I should say, as a disclaimer, that this isn’t going to be entirely accurate because I only used the PRIMARY author of each book. I read a lot of James Patterson in 2018 and many of those were coauthored by Maxine Paetro. Had I cataloged those books as books by a female, this may look different.
No handy graph for this next one, but worth mentioning anyway.
Independently published (or small press published with no agent) books accounted for only 3% of the books I read in 2018.
I can already tell you that number will be higher for 2019. It remains to be seen how much higher it will be.
How about age categories?
Most people who I talk to expected to see a huge skewing of the data in favor of Young Adult books. Not so. In fact, here’s that graph.
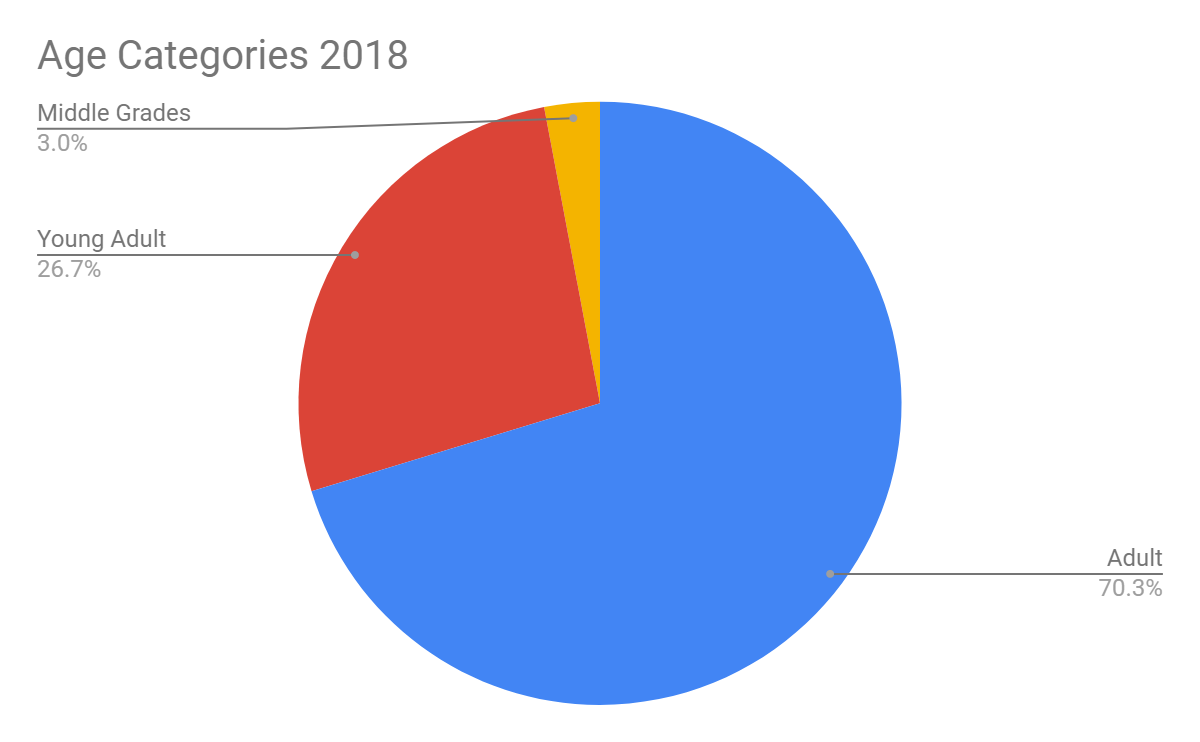
Not even close, right? It turns out adult age category is almost ¾ of what I read. I do find the small slice of middle grades on this one and the absolute lack of children’s books to be interesting. My first thought was that I, perhaps, didn’t put all of those on Goodreads. But I can’t recall any that I read that weren’t represented in the list of 101 books. So I guess I just didn’t read much of those age categories last year. Oops!
How about Genre?
As you know if you subscribe to my YouTube channel or watch my monthly wrap-up videos, I will read just about anything. I feel like my genre graph for 2018 proves that.
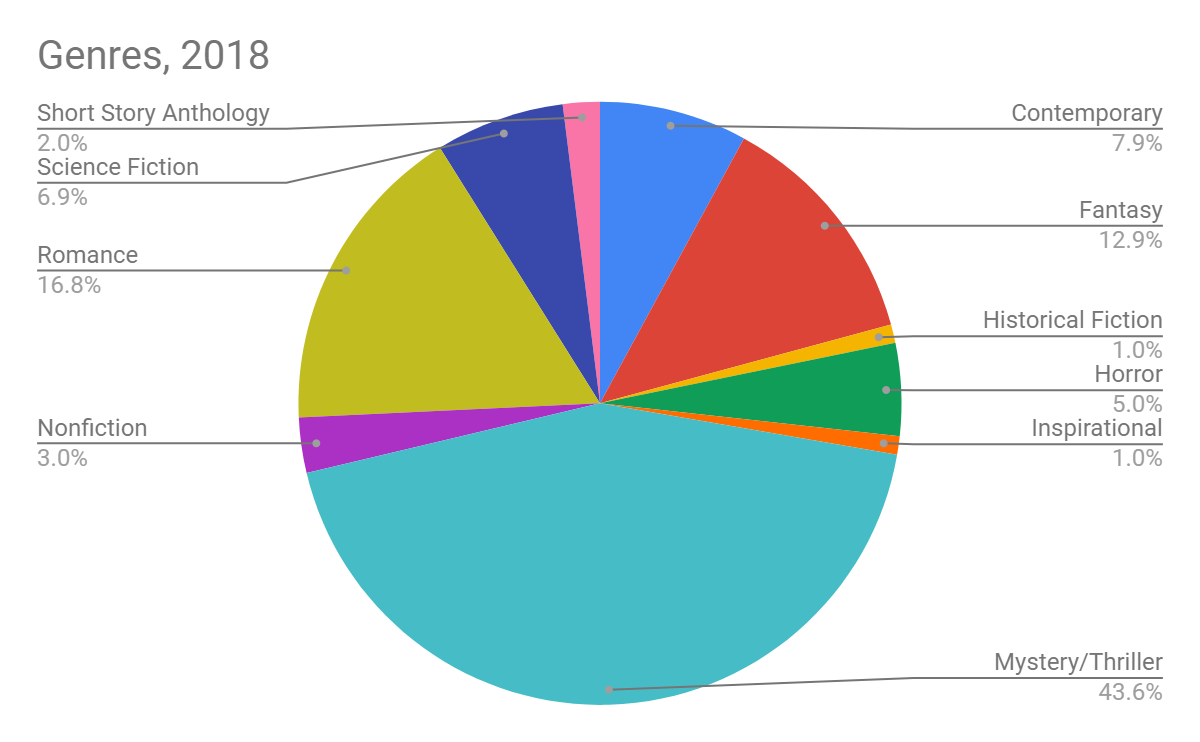
Mystery/Thriller accounted for almost half of my reading last year. Second place is claimed by Romance. That shocked me, at first, because I’m pretty outspoken about how annoyed I get with romance novels in general. Then I remembered 2018 was the year when I tried to find one I liked, actively reading whatever anyone suggested. It’s worth noting that I do actually enjoy YA romance, which accounted for a very small percentage of this romance section.
Star Ratings immediately come to mind once I start thinking about romance. So I decided to dive into my overall ratings of books. Here’s how that broke down in 2018.
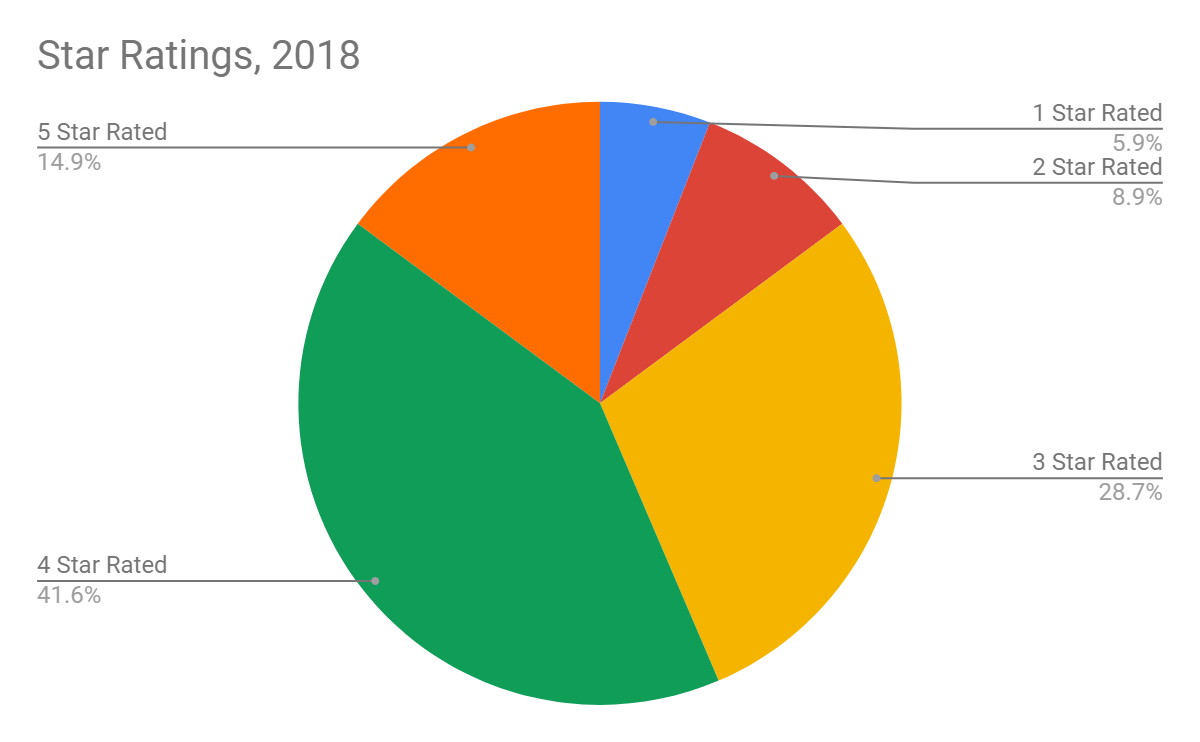
As you can see 4 star books are the largest category here. That makes sense because I’ve been reading long enough to have an idea of what I like, for the most part. I’m lucky in that. More than half of this circle is books I genuinely loved (4 or 5 star). I also found it interesting that if you add the 1 and 2 star together it’s about the same size as the 5 star. Meaning I pretty much hated about as many books as I absolutely loved in 2018. I did take a peek at 2019, just for comparison purposes, and I have only rated 2 books below three stars. I honestly think this romance attempt I made in 2018 is to blame for that (a claim which is supported by the fact that only one book rated 1 star in 2018 is NOT a romance book).
One last analysis came when I decided to dig into release years. If you’re a subscriber to the YouTube channel you’ve probably noticed I will read new books as well as backlist books. I don’t really have a preference. The oldest book I read in 2018 was a Hardy Boys mystery which was originally published in 1948. That means the span of book release years was 70 years. I split the release years into categories for this graph. Books published before the year 2000 (which would make them over 18 years old), books published between 2000-2010 (making them 8-18 years old), books published from 2010-2018 (1-8 years old), and books actually published in 2018. Here’s that graph.
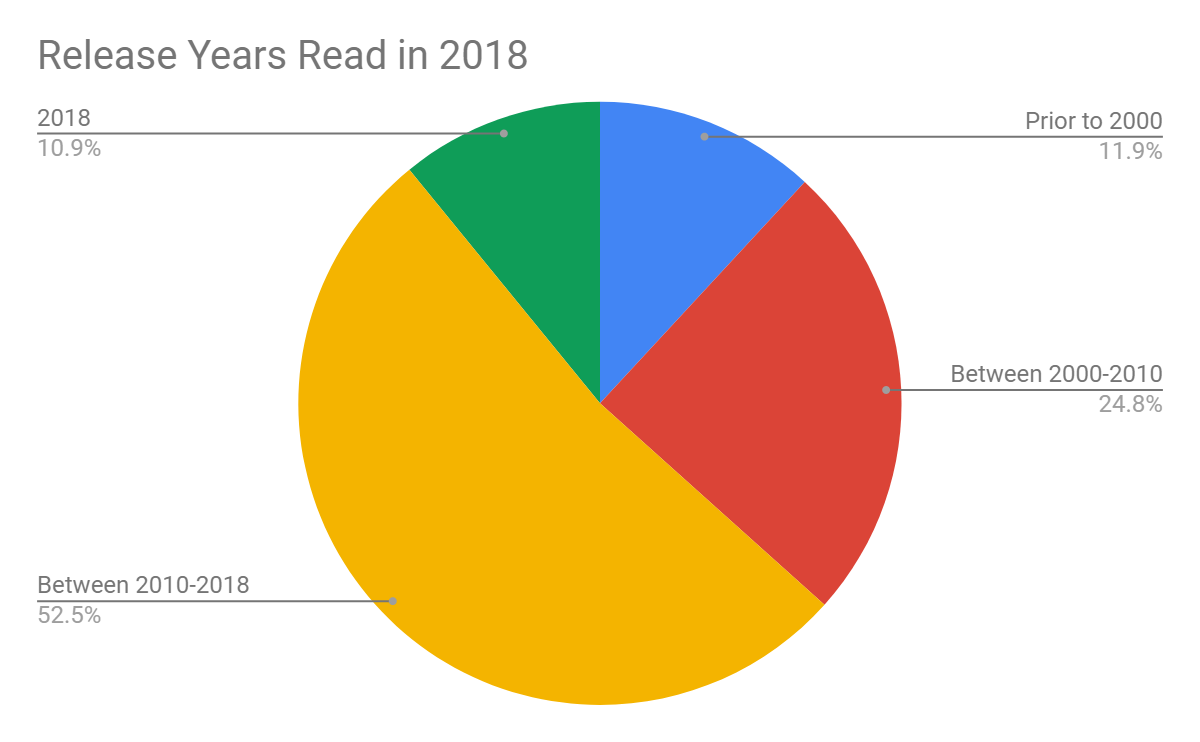
I was actually surprised here. I was expecting the over 8 year old (red) category to be larger and the less than 8 year old (yellow) to be smaller. Really this means about ⅔ of what I read in 2018 was less than 8 years old (yellow and green combined). That’s not too bad.
That’s all the analysis I did on my reading data for 2018. I plan to really dig into the comparisons after 2019 is wrapped up when I can look at two years of data side-by-side.
If you hung in with my analysis this long, drop a comment and let me know what you found interesting. Or, if there’s something else you’re wondering about my reading habits, just ask!
Thanks for reading! If you’re interested, check out the YouTube video to see which one of my family members was best able to answer questions about my overall reading habits.
Leave a Reply