

I realize September is creeping to a close, but I never got a chance to dig into my statistics from August. Today, I sat down and started looking at them. I found some truly fascinating things happened when I compared July to August. Of course, that may just be the inner statistics geek in me coming to the party. Anyway, here are some statistics.
Totals
Let’s ease into this by talking about general totals.
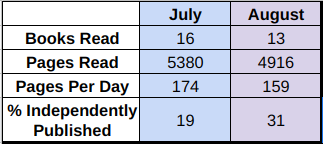
As you can see, I read more books in July than August. I can’t even claim they were shorter books because it was also more pages per day. But, I’m proud of the fact that my percentage of independently published titles is up 11 percent.
Thanks to everyone who has submitted requests to have me review your independent title on my YouTube channel. I’m thoroughly enjoying giving back to this AMAZING community.
Submit your request here:
https://tabathashipleybooks.com/book-reviews/
Gender
Next, I took a look at the gender of the primary authors of the books.
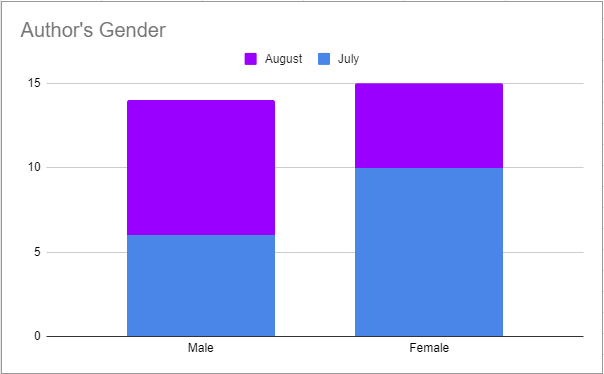
This graph shows that I more female authors in July (blue) but more male authors in August (purple). It also shows that for the two month period, the ratio is pretty even with female authors inching out male authors.
Age Categories
I track the books that I read in a given month by the age category the publisher (or author) identifies as the primary audience for the book. This is not always simple to identify as many books could fall into more than one category or may even be classified as “new adult”. I give the more accurate age category in those cases on my review videos. For the purposes of statistics, I pushed each book into one of general categories: children, middle grade, young adult/teen, or adult.
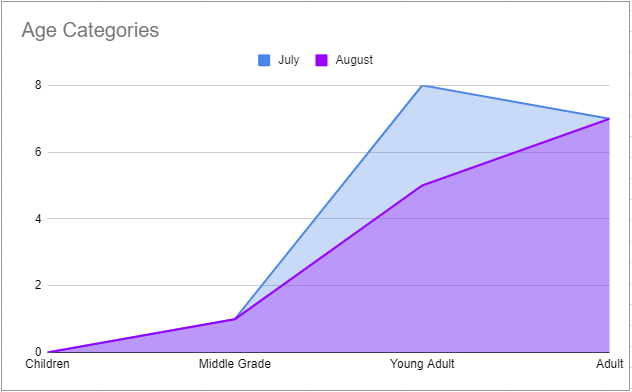
This graph was super interesting to me. As you can see, I read the same number of children, middle grade, and adult books in each of these months. I read more books in July but all of those “extra” books fell into the young adult category. My hypothesis here is that I read young adult books faster than other books. I think this is something I’ll have more fun exploring in future months.
Genre
Tracking genre is always a challenge, I think. I always categorize a book by the primary genre. In many cases there are certainly leanings of something else, which can skew the data. Nevertheless, here’s the analysis.
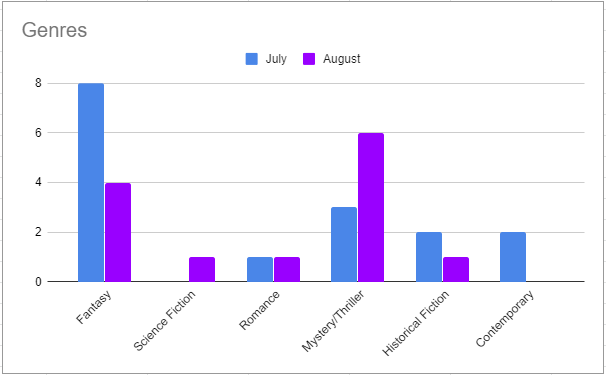
Fantasy dominated in July (blue) and mystery/thriller books dominated in August. This isn’t really a surprise, as those are my two favorite genres to read. I keep noticing blips in other genres, like contemporary, when I analyze month by month. I’m hopeful that will lead to a nice, well-rounded year after 2019 comes to an end.
Release Years
You’re likely aware that I’ve started accepting reviews for my YouTube channel right here on my blog. In addition to that, I’ve recently become a reviewer for NetGalley, BookSirens, and HiddenGems.Basically that means more people are requesting I review their newer books. That has made a huge impact on the release years that I’ve been reading. Some of that shows on this graph.
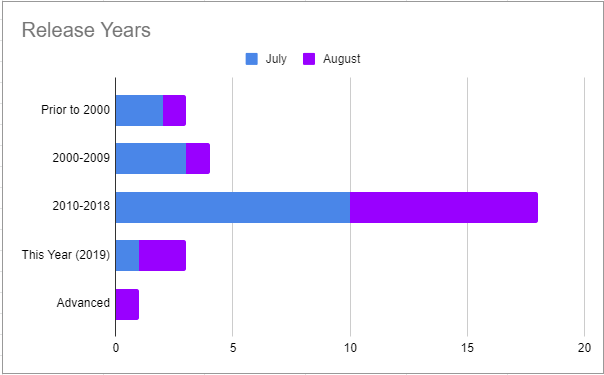
As you can see both months continue to have the majority of the books I’m reading come from recent back-lists (2010-2018). However, August had a lot more 2019 releases and even one release set to hit bookstores in 2020. July, in contrast, had higher numbers of books published before 2010. I have a feeling this trend will continue toward newer releases as I continue to work up a seriously long review schedule for the coming months.
Star Rating
All of that data is wonderful, but it all comes down to star rating. For this two month comparison I decided to group a few of the star rating categories.
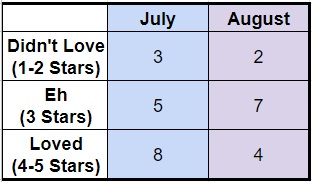
This really matches with how I’ve been feeling about my reading lately, I think. August had a huge uptick in books that were just “eh”. That’s basically a rut around here.
Wrapping it Up
September is already underway and I have BIG plans for October already.
How are your reading goals shaping up? Drop a comment to let me know!
Leave a Reply